Badges


Audience: Paid, Girl Scouts of America
Tools:
Back End: Node.js, Looker API, TypeScript
Front End: HTML, CSS, JavaScript, D3.js, graphScroll.js, d3-annotation.js
Data Analysis: Python, Tableau
Process:
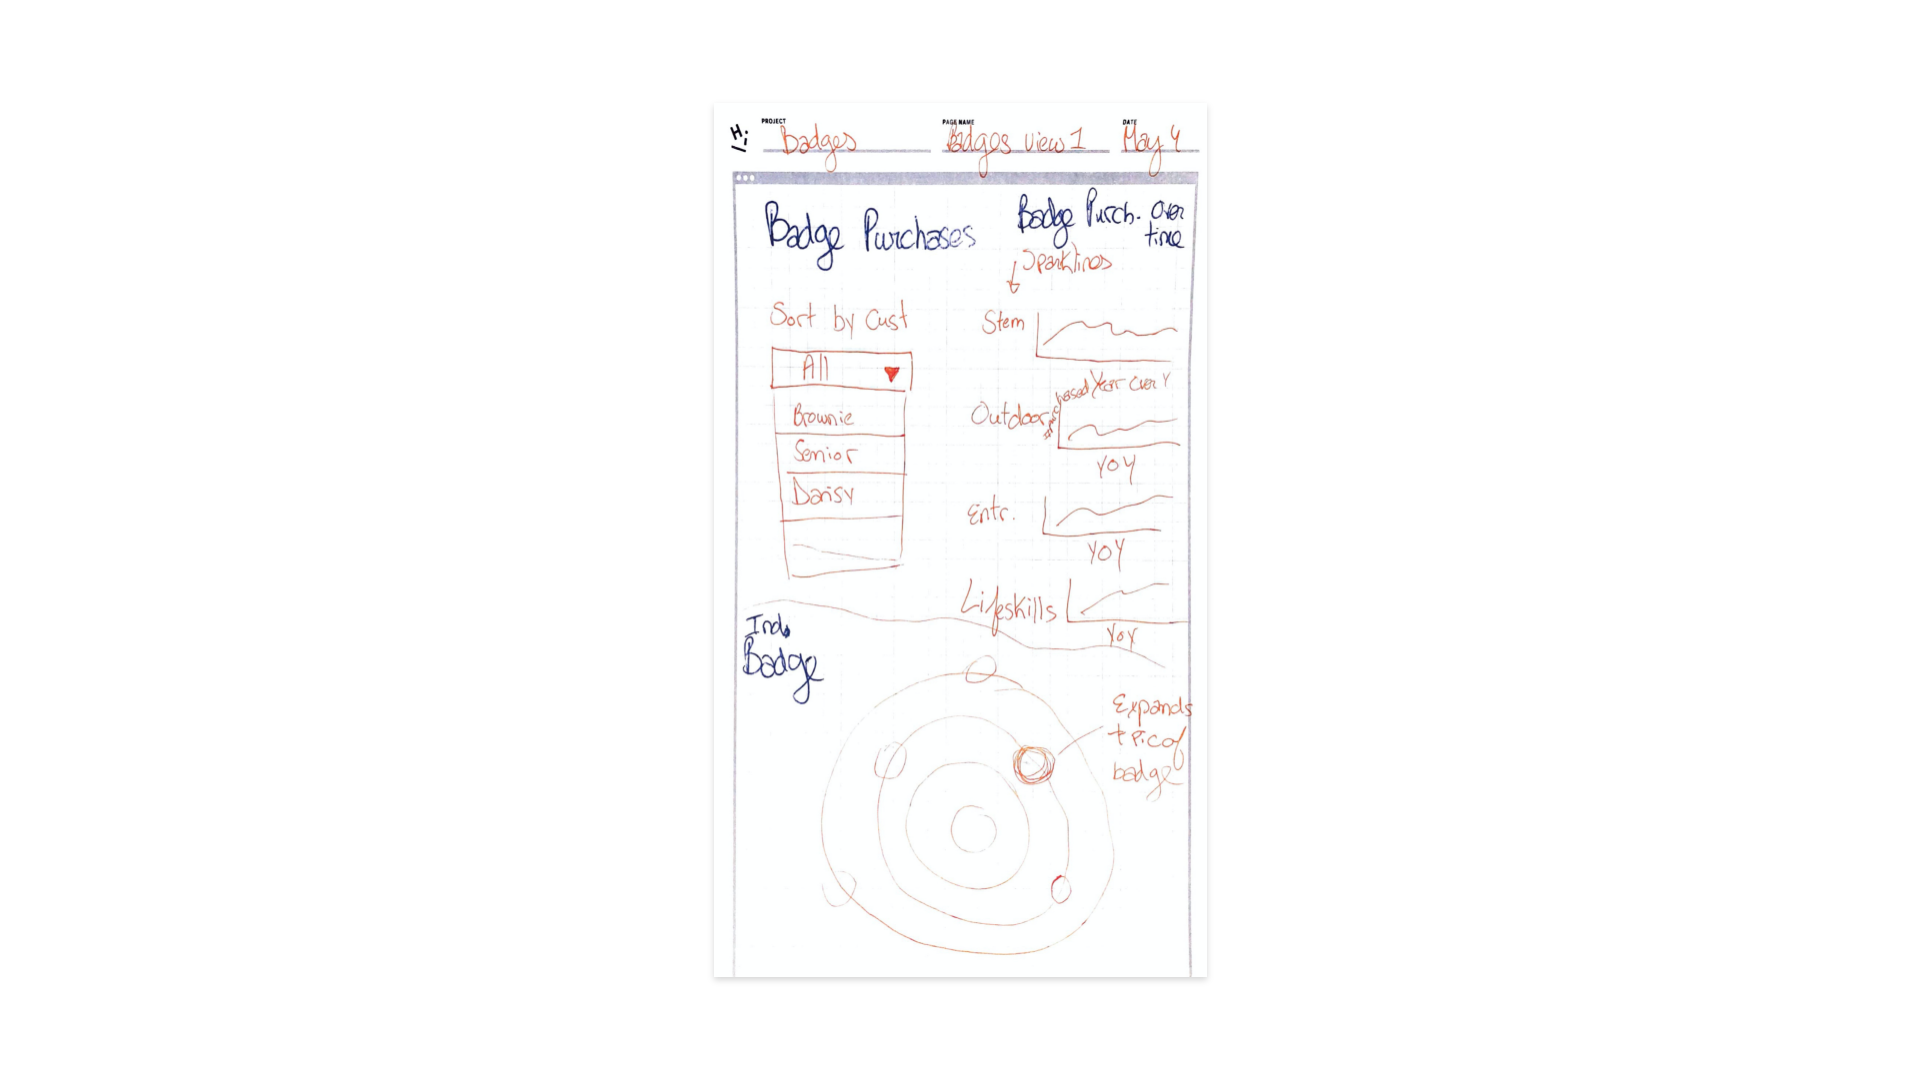
Ideation & Business Question: Girl Scouts USA has four core pillar programs for badges earned: STEM, LifeSkills, Entrepreneurial and Outdoors. There had never been a visualization that explored badge purchases at a pillar level. I wanted to analyze badge purchases per pillar over time, over a year and by council.
My initial sketch below to get the visual cues of what I wanted to visualize.

Data Structure & Coding:
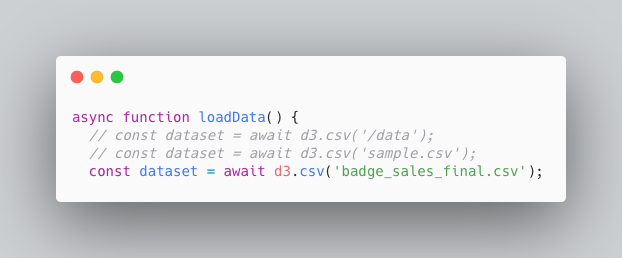
Initially, I used a CSV file that captured a sample of the dataset to build the structure but the end goal was to have a dynamic visualization that updated as the transactions updated. By utilizing TypeScript, I could tap into the Looker API where the data was stored, but have the ability to create a custom visualization that tells a better story than the visualization options on Looker’s UI.

Visual Design: I wanted to keep the visualization playful by incorporating saturated colours representing the pillars. The initial landing page is a grouped splash of some of GSUSA’s collective badges created on Adobe Illustrator. By incorporating the graphScroll.js library for part of the visualization, I could use the opportunity to make some callouts on the line charts.